Top 5 Acoustical Issues in Houses of Worship and How to Solve Them
April 30, 2018
LEED Certification and Acoustics
June 28, 2019Acoustical Testing: Defining the Problem
At Haverstick Designs, we have treated thousands of spaces around the world, each with its own unique acoustical problems and solutions. Through our experiences, we have discovered an important fact about room acoustics: no two rooms are the same. If no two rooms are the same, then no two rooms will have the same acoustic solutions and treatments. Due to this fact, the most important element of creating a treatment plan for a given room is to first understand the issues that exist within the space. In this article, we will break down the process we use in discovering a room’s acoustical issues through testing and analysis.
Physical Measurements
One of the most important characteristics of any given room is its geometry. It is important to obtain accurate physical measurements of a room for several reasons. The computer modeling done for the room’s acoustical properties depends greatly on accuracy of both the surface materials used and the physical dimensions of the space. The dimensions allow us to accurately predict what will happen acoustically in the room through our models. Any permanent feature or object such as walls, windows, doors, furniture, decorations, etc. should be noted, as they could potentially affect any future treatment decisions. In the same vein, it is also important to know all surface materials in a given space as they will impact our decisions, and are particularly important for calculating the reverberation time for larger rooms.
Subjective Listening Tests
Our ears are the best measurement tools for assessing an acoustical environment. Audio professionals, whether they are producers, mixers, mastering engineers, or studio designers, will use a set of hand-picked recordings or reference tracks to get an understanding of the environment in which they are working. By listening to the same audio recordings that we have heard in multiple rooms and know very well, we are able to get a better working knowledge of a room’s acoustical qualities.
Acoustical Measurements
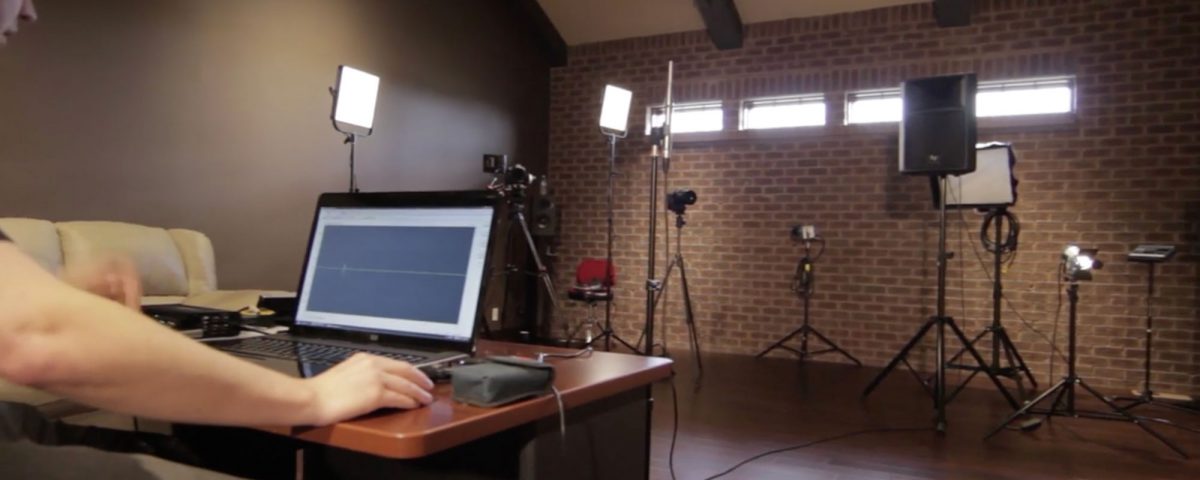
Capturing the acoustical measurements of a room requires some technical skills and basic knowledge of audio recording. We use an omnidirectional microphone, which captures sound equally from all directions. Using the sound system that will be used in the space (or a test loudspeaker if the sound system has yet to be installed), we capture test sounds such as frequency sweeps or pink noise with the omnidirectional microphone. These recordings are processed through software, which provides us with various metrics used for analyzing acoustical properties.
Like we said before, each room is different. Within a recording studio there may be several different spaces: control rooms, live rooms, isolation booths, listening spaces, etc. As each of these rooms serve different functions, the important metrics to observe in each space will be different along with the testing methodology. In a live room where musician position always changes, it is important to take measurements at various locations of the room to better understand how the room sounds overall. Frequency response, impulse response, Reverberation Time (RT) and waterfall plots are all helpful in assessing the performance of a live room.
In a control room, however, there is one set mixing position. For this reason, we use acoustical analysis to pinpoint which position will be best to use for mixing, and then take rest of our measurements from this spot. This step cannot be understated; in several cases, moving a mixing position forward or backward by only a few inches will yield drastic improvements in frequency response!
Once the optimum mixing position has been found, we take more acoustic measurements of the room from this position. We again will look at the frequency response as it is a determining factor in how well mixes will translate to other systems outside of the room. Analyzing the frequency response helps us decide on what types of treatment to use in the room, depending on areas of build-up or cancellation. For example, the frequency response graph below shows an example of the before and after results of treating a space. The green “before” line, helped us decide on which treatments were necessary for the space. The red “after” line shows the improvements that were made. As with all rooms, there are limitations (budget, physical space, aesthetics) and compromises when it comes to treating a room, but the before and after results are significant.
The impulse response is also used to help us pinpoint certain reflections in the room. Looking at the graph below, each peak shows a different reflection. By using the speed of sound (1.13 feet per millisecond), we can pinpoint where each reflection is coming from and thus treat them appropriately.
Another metric we analyze in control rooms is the waterfall plot. This type of plot shows how frequencies linger over time. The x-axis (left to right) represents frequency, the y-axis (up and down) represents sound pressure level, and the z-axis (coming out of the screen) represents time in milliseconds. The ridges seen throughout the graph are indicative of room mode issues in the space at certain frequencies.
To Recap
There are three basic types of measurements we take when first testing a room:
- Physical Measurements
These measurements are key to ensuring the success of computer models we use later in the design process, as well as creating an accurate AutoCAD drawing to deliver to our clients.
- Subjective Listening Tests
In doing this step, we are sure to adapt ourselves to the acoustic environment. The key word in this step is subjective. Each person will have their own reference tracks they use to familiarize themselves with a space. Be sure to develop your own for your own future critical listening endeavors!
- Acoustic Measurements
This step is where we obtain concrete data we use to create a unique treatment plan for a room. By noting metrics such as frequency response, impulse response, Reverberation Time (RT), or waterfall plots, we can understand how sound propagates throughout the space.
Thank you for reading! We hope this helped give a bit of background and explanation into what we do and how we begin testing an acoustic space. Like most things in life, our method has been created over time with practice and repetition.
For Reference:
Everest, F.A & Pohlmann, K.C. (2015). Room Acoustics Measurement Software. In Master Handbook of Acoustics, 6th Edition (pp. 515-532). New York, NY: McGraw-Hill.

